

Additional information on Inflation
By: Helen Dow
The Money Supply
The supply of money should not outpace what the country needs to handle its growth. The Federal Reserve monitors and regulates this supply of money in circulation and they track and report on it with what they refer to as M2SL. Generally, M2SL is the amount of money in the banks that is a cash or cash equivalent (checking, savings, money market).
The supply of money is not the only driver of inflation but is often the most dangerous. Throughout history, when a government causes the increase to the supply of money (printing), that is not aligned with a country’s production (Gross Domestic Product or GDP) or an underlying value (e.g., gold, oil), there is a reset of its value. In other words, inflation on the cost of goods and services is really a deflation of the value of the currency. Everything being equal, the asset doesn’t change value, it is the dollar that decreases in value. Without correction or a stable valuation of that currency, confidence can erode which will compound the problem.
Below is a chart showing the supply of money in circulation, marked by the federal reserve’s measure of M2SL growth since the 1960s. The red line is the charted M2SL levels in billions (for clarity, the last data point is $21.6 trillion). The black line is a year-over-year percentage growth of M2SL. In other words, the black line is the yearly percentage increase in money supply in our economy. From 2020 to 2021, there was a 25% increase in the money supply. This is unprecedented in the years this has been measured.
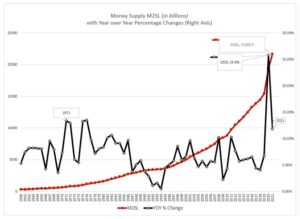
Source of M2SL and data: https://fred.stlouisfed.org/series/M2SL
US Debt
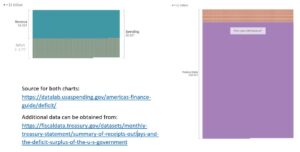
The Federal Reserve provides the money, but they do not cause the need for the increase. Government deficit spending has been the biggest driver recently. The pandemic brought on unprecedented disruptions. Our government increased spending to businesses and individuals through several very expensive supports. Our production plummeted, but our access to financial resources was never greater. Fortunately, government spending has slowed but it needs further curtailment. The US deficit spending for 2020 was $3.1 trillion.
The charts below give a visual of the US deficit spending for 2021 at $2.8 trillion and the total debt level at the year ended 2021. Deficit spending is financed through government loans. Our national debt at the end of 2021 was $28.4 trillion and shows the 2021 deficit in red. We know this debt is now above $30 trillion.
2021 US Deficit Spending 2021 US Debt with 2021 Deficit Added
Inflation Measurements
The Bureau of Labor Statistics releases the Consumer Price Index (CPI) which is our best measure of the impact from inflation. Below is a chart that shows the CPI – All Items, monthly increases. The left axis gives the seasonally adjusted rates as released by the Bureau. The right axis is annualized by simply multiplying by twelve, which you can do because it is seasonally adjusted. This is only to translate to a more meaningful number and comparable to historical annual amounts. The Bureau of Labor Statistics that releases this information gives an annual number that is for the previous twelve months. This produces a lag and understates the current levels in an increasing-rate environment. For July of 2022, the previous twelve months totaled 8.5%, but you can see in the chart that the trend is of an increasing rate. Energy has been the largest driver of fluctuations and the down spikes are from releasing reserves and lower futures based on the impact from an impending recession. The Food index has less volatility but a similar increasing trend.
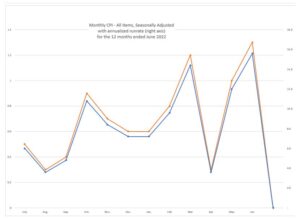
Source of data: Consumer Price Index Summary – 2022 M06 Results (bls.gov)
As stated, the money supply increased largely due to an expansion of government spending, increased our national debt levels, and provided the catalyst for entering an inflationary period. Now that we are here, the response of the Federal Reserve and the US government are critical to cool down a very heated set of inputs to inflation. Ignoring would be disastrous and hopefully there will be a commitment to getting this under control. The unfortunate part is it will not be without economic pain, and that will test their resolve.
Interest Rates
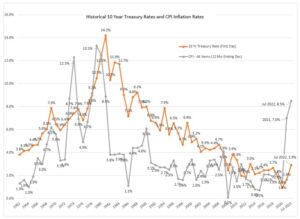
Another chart to show a historical view of the alignment between inflation and interest rates is a graph of CPI rates since the 1960’s, represented by the grey line, layered with the federal 10-year treasury interest rates, represented by the orange line. Note that the 2022 data point is the 12 months ended July 2022 and not a calendar 2022 value. On the current trajectory, we would expect the 2022 CPI to finish higher.
Sources of data:
CPI 12-month percentage change, Consumer Price Index, selected categories (bls.gov)
10-Year Treasury 10 Year Treasury Rate – 54 Year Historical Chart | MacroTrends
Historically, you can see the correlation between inflation and interest rates. And looking at the chart, the expectation would be that the interest rates will go up and substantially. Here is where history may not be a predictor. I’m not convinced it will follow exactly like the 1970s. Our large national debt is a major difference between now and then. In the 70’s, our national debt was less than 40% of GDP. It is now above 130% of GDP and high interest rates could be disastrous to a country that has its financing structured on low interest rates.